
The Anatomy of a Marketing Analytics Report — And Free Analytics Tools

Successful marketing requires analytics. If you don’t track your campaigns, you won’t know what works and what doesn’t. And if you continuously invest time and money into things that don’t work for you, you’ll throw away your resources and sabotage your marketing efforts.
Reports show that a comprehensive analytics approach can free up 15-20% of marketing spend. If saving that much cash isn’t an incentive to rethink your analytics approach, well, we can’t help you.
Here are the basics that you should include in your monthly analytics report:

Website Analytics
What’s your total monthly traffic? Your website is your 24/7 salesperson, so the more people that see it, the better! We look at the number on its own and in the context of other months.
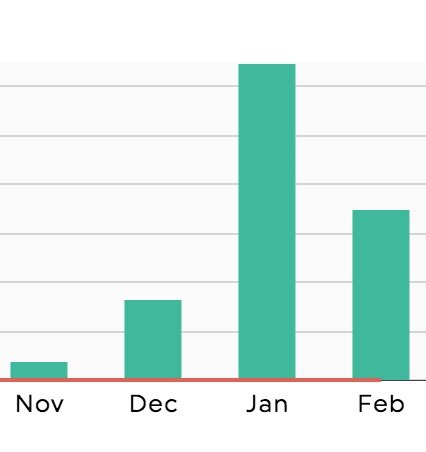
Some months may not show much time, while others may shock you. Take this graph for example. In January, we wrote a piece of content for one of our client’s, and their traffic skyrocketed. In February, we didn’t produce any content, but that same blog post still drew in around 100 viewers. Thanks to analytics we know that content marketing works exceptionally well for this company.
Take a look at where your traffic is coming from. Are hundreds of people coming from Instagram? Thousands from Facebook? The channels with high CTR’s are the most valuable to you, so invest your time there.
We get hundreds of visitors from Pinterest every month, so we always keep up with our Pinterest account, something we may not do if it weren’t for telling analytics.
What are your most popular pages? Your popular pages will give you insight into what pages your visitors are looking for —- and what content they like to see. If your blogs are very popular, write more! If your FAQ page is a hit, consider promoting it on social media.
One of our most popular pages, month after month, is an old blog about color psychology. We’ll never take it off our blog because it regularly draws hundreds of people to our site.
Social Media Analytics

1. Gather the top posts from each platform to see what’s working really well. Jot down the dates and times of these posts so that you can adjust your posting schedule to hit those times. And of course, post more content that is similar to your most popular posts.
This month, we realized that posts scheduled between 10 am and 1 pm performed the best. In the future, we’ll schedule our posts in that window for optimal engagement.
2. Take a comprehensive look at which posts are not getting engagement. What can you do to improve these posts?
We have noticed that while some posts get little engagement, they do drive people to our site. At the end of the day, that’s the goal of a business’s social media! Each post should work for your business in some capacity.
3. Evaluate paid ads. Ineffective ads are a waste of money. You will get more conversions if you channel your resources into the one or two ads that perform well. And if none of your ads are getting clicked on, then you should re-evaluate the strength of the campaign.
Bonus tip: When creating new ads, hold try A/B testing to assess different visuals or different messaging. Whichever ad gets the most engagement should be the one you continue to run.
Do you see why social media analytics are important? Without them, you end up throwing time and money into social strategies that don’t create conversions.
Email Marketing Analytics
1. What is your open rate?
Email open rates vary by industry, but most hover around 20%. If your open rates are much lower than this, ask yourself why. Are your subject lines enticing? Are your messages going to the right people? A low open rate is a telling sign that something isn’t working, but you will have to do some digging to figure out what, exactly, that is.
2. What are people clicking on?
Look at the breakdown of where your click throughs are coming from. Do people love to read your full blogs? Are they enticed by your YouTube videos? Find what your audience is clicking on and share more of it.
3. Look at your unsubscribe rate.
Your unsubscribe rate should be low — below 0.5%, according to Mailchimp. If your rate is much higher than that, you may be sending content too frequently or to the wrong people. You also may not be delivering valuable content that your audience cares about. And if one email had a particularly high unsubscribe rate, that is a good example of what you shouldn’t be sending out.
Free Analytics Tools
While there are plenty of paid analytics tools out there (we love DashThis), you can pull analytics for free as well. Here are the best free tools to use:
Your website host. Every website host (Wix, Wordpress, Squarespace) should give you access to your site’s analytics. We use Squarespace for our own website, and it gives us access to all the important metrics we need. Plus, Squarespace makes pulling analytics easy with its user-friendly backend.
Your social media accounts. Facebook, LinkedIn, Pinterest, and Instagram all provide comprehensive data to business account users. Just be sure your page is registered as a business, not personal, account, and you’ll have access to even more numbers and graphs than you need.
Google Analytics. Google Analytics is a free tool that can give you a deep dive into your site’s analytics. While you can get a, well, host of data from your website host, Google Analytics can take your metrics to the next level.
When it comes to marketing analytics, start with the basics and work your way to the more advanced statistics. These tips should get you started, but if you want more content on marketing analytics, let us know in the comments below!